Last updated: May 2026
Most PPC reporting tells you what happened. The numbers worth tracking tell you what to do next. The most important PPC metrics for that second job are click-through rate (CTR), cost per click (CPC), conversion rate, return on ad spend (ROAS), and cost per acquisition (CPA). Beyond those fundamentals, advanced metrics — view-through attribution, quality score, impression share, lifetime value modelling — surface the parts of campaign performance that click-based reporting misses. Knowing which numbers matter, how to calculate them, and what benchmarks to aim for is the foundation every improving paid program is built on.
The most important PPC metrics every team should track:
PPC metrics are like your compass in the vast digital landscape, guiding you toward your campaign goals. Without them, you're flying blind, and your budget could be leaking value across every campaign you're running.
In this guide, we're decoding the most important PPC metrics for campaign success — what they tell you, how to calculate them, what the 2026 benchmarks look like, and how to interpret them when they're saying conflicting things. We'll cover the fundamentals every team should track, the advanced metrics that surface in the gaps, what counts as "good" in the current paid landscape, and a real Major Tom client campaign (Teck Resources) where data-driven measurement carried the work.
If you need help applying any of this, our paid media team works on this exact question across industries and campaign types - and we're great at winning awards for this.
Without PPC metrics, your campaign is flying blind. You need to decide what to measure so you know whether your effort and budget are working. The metrics that matter most depend on the campaign's objective — top-of-funnel campaigns live and die by reach and CTR; lower-funnel campaigns live and die by ROAS and CPA — but disciplined measurement is what turns paid media from a cost centre into a growth lever.
Having PPC metrics in place lets you make data-driven decisions. Without them, you'll waste time and money optimizing in the wrong direction. That said, interpreting PPC metrics accurately is harder than it looks. A few of the common pitfalls:
PPC metrics rely on accurate tracking and data collection. Issues like tracking code errors, duplicate firings, and discrepancies between different tracking systems can lead to metrics that look fine but are quietly wrong. If you're an agency working with a client, they may not share all the relevant data, which makes accurate reading harder. Server-side tagging and conversion modelling are the durable fixes for both problems.

Different attribution models — last-click, first-click, linear, data-driven — yield meaningfully different results from the same underlying campaign. Choosing the right one for your business and sales cycle matters, and shifting models mid-campaign tends to make trend lines unreadable. Google's data-driven attribution is now the default in Google Ads for most accounts, and it generally produces more honest credit allocation than last-click — but the team has to know what model is running to interpret the numbers correctly.
Seasonal and market fluctuations commonly affect PPC performance. Failing to account for these variations can lead to the wrong conclusion about your campaign's effectiveness. Always compare like-to-like periods, and treat anomalies in the data as questions to investigate rather than answers to act on.
PPC metrics don't occur in a vacuum. Different metrics interact with and affect each other. Increasing your ad spend may boost clicks but not your conversions. Lowering CPC by bidding more aggressively on lower-quality inventory may improve the CPC line but degrade the CPA line. Understanding how the metrics relate is what separates campaign managers from campaign optimizers — the second-order effects are where the real performance is won or lost. In our experience, the metric most clients undervalue is view-through attribution: it often reveals that display and video are doing more work than click-based models suggest.
So what are the metrics for PPC? Here are the most important ones to track, how to calculate each, and what the 2026 benchmark range looks like where one is available.
CTR measures how often users click on your ads after seeing them. A high CTR indicates that your ad is relevant and compelling to your audience — which leads to more traffic and, often, to higher conversion volume. Per 2025 LocaliQ benchmarks based on 16,000+ campaigns, the average search CTR across all industries is 6.66%, ranging from 5.44% (Dentists) to 13.10% (Arts & Entertainment).
Calculation: CTR = (Total Clicks / Total Impressions) × 100
CR is the percentage of users who complete an action — making a purchase, filling out a contact form, downloading an asset — after clicking on your ad. A high conversion rate shows your ads and landing pages are working together to drive intended actions. The 2025 LocaliQ average CR across all industries is 7.52%, ranging from 2.55% (Finance & Insurance) to 14.67% (Automotive Repair).
Calculation: CR = (Total Conversions / Total Clicks) × 100
CPC represents the average amount you pay each time a user clicks on your ad. Monitoring CPC helps you manage your advertising budget and reveals the efficiency of your ad spend. Lower CPCs can compound into significant savings if your CR holds. The 2025 average CPC across all industries is $5.26, ranging from $1.60 (Arts & Entertainment) to $8.58 (Attorneys), per the same LocaliQ data.
Calculation: CPC = Total Cost / Total Clicks

For the broader cost framing, see our guide to budgeting media buying costs for better ROI — the metrics on this page tell you whether the budget is working.
CPA measures the average cost of acquiring a new customer or lead through your PPC campaigns. A lower CPA means you're efficiently converting users into customers at a sustainable cost — which is what drives ROI. Average CPL across all industries in 2025 was $70.11, up 5.13% from $66.69 in 2024. The range runs from $28.50 (Automotive Repair) to $131.63 (Attorneys).
Calculation: CPA = Total Cost / Total Conversions
ROAS calculates the revenue you generate per dollar spent on the campaign. ROAS differs from ROI in that it doesn't factor in the cost of doing business — any number greater than 1 indicates you've made more revenue than you spent directly on the campaign. ROAS varies too widely by vertical and margin structure to cite a single universal benchmark; the right ROAS target for your business depends on your unit economics, not on an industry average.
Calculation: ROAS = (Revenue Generated from Ads / Total Cost of Ads) × 100
ROI is the broader measure of an investment's profitability. For PPC campaigns, ROI factors in the cost of the product or service alongside ad spend — which is why ROI is typically lower than ROAS for the same campaign. ROI is the metric finance teams want to see; ROAS is the metric marketing teams optimize against day-to-day.
Calculation: ROI = [(Revenue Generated from Ads − Total Cost of Ads) / Total Cost of Ads] × 100
Want to put these to work? Our six tips for stellar ROI on paid advertising campaigns cover how to take action on the numbers.
QS is a Google Ads metric that evaluates the relevance and quality of your campaigns by looking at ads, keywords, and landing pages. A higher QS leads to better ad positions and lower CPCs — Google rewards advertisers who provide a better user experience.
Calculation: Quality Score is not directly calculated. It is assigned by the platform (typically Google Ads) on a 1–10 scale.
IS shows how your ad stacks up against the total possible impressions for your target keywords. A high IS suggests your ads are attracting attention and appearing often when people search your target terms. IS is essential to understanding campaign reach — and the lost-IS variants tell you why you're missing impressions (budget, rank, or both).
Calculation: IS = (Total Impressions Received / Total Eligible Impressions) × 100
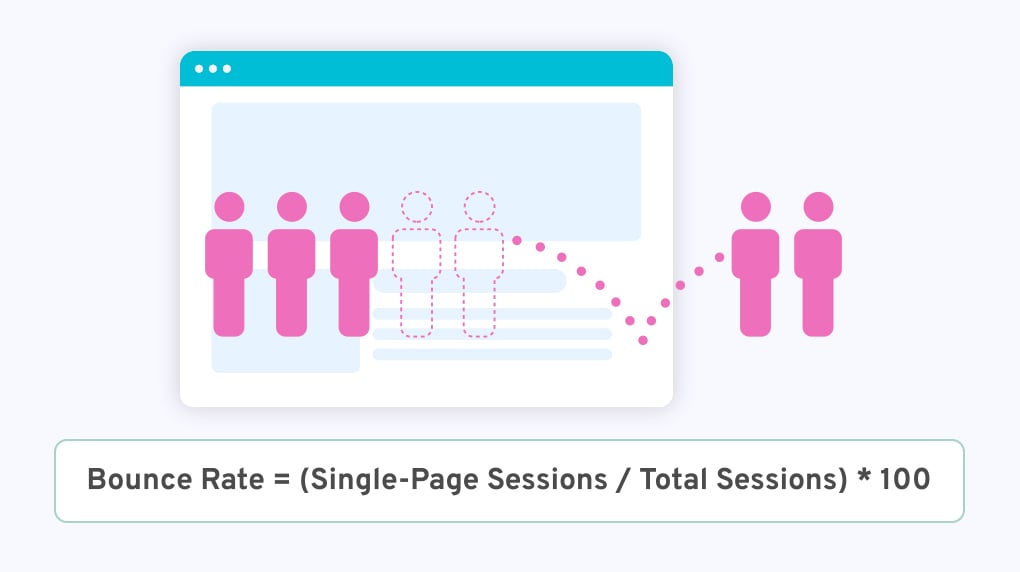
Bounce rate is the percentage of users who land on your site but leave without further interaction. A high bounce rate may indicate a disconnect between the ad and the landing page. If the disconnect is there, look at the ad and the landing page from your user's perspective and see if you're misleading the audience. Tightening this gap improves both user engagement and conversion.
Calculation: Bounce Rate = (Single-Page Sessions / Total Sessions) × 100
Ad spend is the total amount of money you invest in your PPC campaigns. Tracking ad spend is foundational to budget management — and to making sure campaigns stay within their allocated envelope while still delivering the results you set out to achieve.
Calculation: The sum total of all costs associated with each campaign, ad group, or keyword.
Less commonly discussed but vital PPC metrics provide deeper understanding of campaign performance. They give you nuanced insight that helps optimize ad strategies in ways the basic metrics can't.
In-depth impression share metrics are specific to Google Ads. They include:
These metrics tell you how often your ads appear and, critically, why they're not appearing when they don't. To find them in your Google Ads dashboard: click Campaigns, open the drop-down menu, select Campaigns or Ad groups, click the columns icon, select Competitive metrics, check the Search impr. share and Display impr. share boxes, and apply. The data will appear in your statistics table.
Ad schedule metrics show how your campaigns perform at different times of day and days of the week. Understanding when your audience is most active and when conversions are most likely to occur lets you optimize ad scheduling — allocating budget and bid adjustments to peak performance periods rather than spending evenly across hours that don't all convert equally.
Analyzing performance by device type reveals how your ads are performing across platforms.
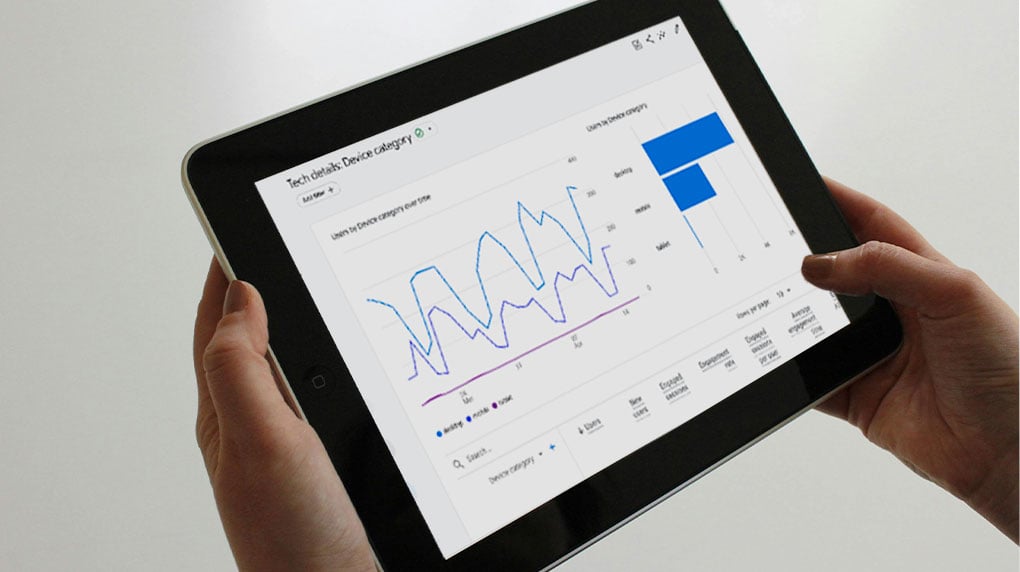
Understanding device-specific performance helps tailor creative, bidding, and landing pages to each device. If your ads aren't set up properly for mobile but most of your audience is shopping on a phone, you're leaking sales. Device-level metrics surface exactly where those bottlenecks are.
Attribution shifted significantly through 2023–2025 with Apple ATT and the anticipated cookie deprecation on Chrome. Then Google reversed course in October 2025 and confirmed Chrome will not deprecate third-party cookies. ATT remains in force on iOS, so mobile attribution still benefits from server-side conversion APIs and platform conversion modelling. The framing that "the cookieless future is imminent" is no longer accurate for Chrome/desktop — but first-party data investment remains best practice, both for measurement durability and for direct-to-customer use cases.
What is a good PPC metric, anyway? How do you know whether your campaign numbers are actually an indication of success? Are your KPIs for PPC being served by your tactics?
Two ways to tell:
When the metrics suggest the campaign isn't working, the next question is usually upstream of the campaign itself. Our guide on when PPC metrics reveal that the broader media planning strategy needs revisiting walks through how to diagnose what's actually broken — and our media planning best practices cover the upstream choices that shape the metrics you'll be measuring.
Teck, a leading Canadian mining company, aimed to promote antimicrobial copper in public spaces through its Copper & Health campaign. Major Tom's data-driven approach was central to the campaign's success.
Teck's award-winning campaign sought to raise awareness about copper's infection-fighting properties — engaging multiple audiences including government decision-makers, the public, students, health leaders, patients, and Teck SR Management. Goals included advocating for copper use, creating pilot program momentum, and enhancing Teck's reputation.
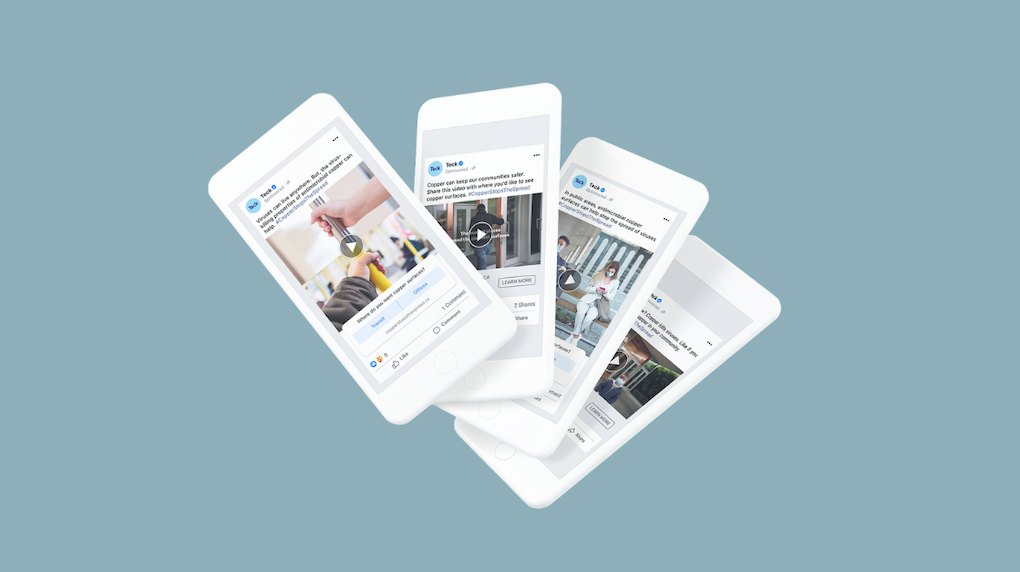
Our strategy used data from Nielsen Vividata to identify the best media channels for each audience. Social media, connected TV, mobile, and out-of-home advertising were all in the mix. Comscore helped pinpoint websites and social platforms for effective targeting. The campaign used a full-funnel approach across display, video, digital OOH, paid social, and remarketing — designed to build awareness and drive conversion in parallel.
Tailored messaging, A/B testing, and location-specific ads engaged each audience effectively. Regular creative refreshes in tandem with our partner, Will Creative, kept the work relevant across the campaign duration. The metric results were strong:
For more on how those results came together, see our three marketing insights from Teck's winning campaign.
PPC metrics empower data-driven decisions, ensuring efficient budget allocation and continuous campaign optimization. Interpreting these metrics is harder than it looks at first, but the benefits compound dramatically over time — and the campaigns that improve quarter over quarter are almost always the ones with the cleanest measurement underneath.
Embrace the data, interpret it wisely, and watch your campaigns climb. Want to keep going? Our advanced PPC ROI article picks up where this guide leaves off — and our paid media team is here to help when you'd rather hand the measurement layer to specialists.
The most important PPC metrics are click-through rate (CTR), cost per click (CPC), conversion rate, return on ad spend (ROAS), and cost per acquisition (CPA). These five capture the full path from impression to revenue and give you the diagnostic signals to optimize each stage. Beyond the fundamentals, view-through attribution, quality score, and impression share metrics reveal the parts of campaign performance that click-based reporting misses.
The 2025 average search CTR across all industries is 6.66%, per LocaliQ benchmarks from 16,000+ campaigns. By industry, CTR ranges from 5.44% (Dentists) at the low end to 13.10% (Arts & Entertainment) at the high end. CTR varies meaningfully by intent — branded search terms typically produce CTRs well above the industry average, while broader keyword campaigns sit closer to the lower end. Use the industry average as a directional reference, not as a target — your business should aim above or below it based on the search terms and audience you're competing for.
ROAS is calculated by dividing the revenue generated from your ads by the total cost of those ads, then multiplying by 100. The formula is: ROAS = (Revenue Generated from Ads / Total Cost of Ads) × 100. Any result greater than 100% indicates the campaign generated more revenue than it cost in ad spend. ROAS differs from ROI in that it doesn't factor in the cost of goods, fulfilment, or overhead — which is why ROI tends to be lower than ROAS for the same campaign.
CPC (cost per click) measures the price you pay each time a user clicks on your ad — it's the standard pricing model for paid search and many performance-focused display campaigns. CPM (cost per mille) measures the price you pay per 1,000 impressions — the standard for awareness-focused campaigns, programmatic display, and CTV. Search platforms typically operate on CPC; programmatic display, video, and brand campaigns more often operate on CPM. Different funnel stages typically call for different pricing models.
Advanced PPC metrics include impression share (and its lost-IS variants for budget and rank), quality score, view-through conversion attribution, ad schedule performance, device-level performance, and lifetime value modelling. View-through attribution in particular is the metric most teams undervalue — it often reveals that display and video are doing more work in the conversion path than last-click reporting suggests. These advanced metrics surface the parts of campaign performance that the basic five can't see.
Effective use of PPC data starts with clean tracking — server-side tagging where possible, conversion modelling to fill in the gaps, and a single source of truth for the metric definitions across your team. From there, the loop is: track, diagnose, hypothesize, test, measure, iterate. Major Tom's work on Teck Resources' Copper & Health campaign — covered in our case study — is a representative example. Nielsen Vividata and Comscore data drove channel selection; full-funnel measurement and creative refresh cycles drove the 9 million video views and 41 million+ impressions over the campaign duration.
The better the data you look at, the better the decisions you'll make.