PPC metrics are like your compass in the vast digital landscape, guiding you toward your campaign goals. Without them, you’re flying blind, and your budget could be leaking valuable resources.
Here, we’re decoding important PPC metrics you need for success. We’ll cover:
If you need help, we offer paid media services geared toward business solutions.
Without PPC metrics, your campaign will be flying blind. You need to decide on what you want to measure so you know whether or not your efforts and budget are working for you.
Having PPC metrics in place will help you make data-driven decisions. Without them, you could be wasting valuable time and money.
That being said, it can be tricky to interpret PPC metrics accurately. Here are a few common challenges you’ll face when interpreting PPC metrics.
PPC metrics rely on accurate tracking and data collection. Issues such as tracking code errors or discrepancies between different tracking systems can lead to inaccurate metrics. Plus, if you’re an agency working with a client, they may not share all of the relevant data with you, making it difficult to get an accurate reading.

Different attribution models (like last-click vs. first-click) may yield different results. This makes it important (and sometimes difficult) to choose the right one for your business goals.
Seasonal and market fluctuations commonly affect PPC performance. Failing to account for these variations can lead to the wrong conclusion about your campaign's effectiveness.
PPC metrics don’t occur in a vacuum. Different metrics will interact with and affect each other. Increasing your ad spend may boost clicks but not necessarily your PPC conversions. Understanding how different metrics relate to one another will help in making informed decisions. But it can be tough to know all of the knock-on effects.
So what are the metrics for PPC? Here are a few you need to track and ways you can calculate them.
CTR measures how often users click on your ads after seeing them. A high CTR indicates that your ad is relevant and compelling to your audience. It can lead to more traffic to your website. It can also potentially increase paid search conversions.
Calculation: CTR = (Total Clicks / Total Impressions) * 100
CR is the percentage of users who complete an action, such as making a purchase or filling out a contact form, after clicking on your ad.
A high conversion rate shows that your ads are effective at driving users to take your intended actions. It’s a good sign your campaign is successful.
Calculation: CR = (Total Conversions / Total Clicks) * 100
CPC represents the average amount you pay each time a user clicks on your ad. Monitoring your CPC helps you manage your advertising budget. Its good insight into the efficiency of your ad spend. For example, lower CPCs can lead to cost savings if your CR remains high.
Calculation: CPC = Total Cost / Total Clicks

Learn more about managing your advertising budget here.
CPA measures the average cost of acquiring a new customer or lead through your PPC campaigns. A lower CPA means you’re efficiently converting users into customers or leads at a reasonable cost. This helps with boosting your ROI.
Calculation: CPA = Total Cost / Total Conversions
ROAS calculates the amount of revenue you gain per every dollar spent on your campaign. ROAS differs from ROI (return on investment) because it does not factor in the cost of doing business. With ROAS, any number greater than one indicates you have made more money than you have spent directly on the campaign.
Calculation: ROAS = (Revenue Generated from Ads / Total Cost of Ads) * 100
ROI is a general measure of an investment's profitability. When it comes to PPC campaigns, ROI may consider factors like the cost of the product or service as well as the ad spend budget. It differs from ROAS because it takes the bigger picture into account.
Find the steps to supercharge your paid media ROI here.
Calculation: ROI = [(Revenue Generated from Ads - Total Cost of Ads) / Total Cost of Ads] * 100
QS is a metric used by Google Ads. It evaluates the relevance and quality of your campaigns by looking at your ads, keywords, and landing pages.
A higher QS can lead to better ad positions and lower CPCs, as Google rewards advertisers who provide a better user experience.
Calculation: Quality Score is not directly calculated. It is assigned by the advertising platform, commonly Google Ads.
IS shows you how your ad stacks up against other ads like yours. It measures the amount of impressions out of the amount of total possible impressions for your target keywords. Impressions are also known as digital views, AKA how many potential eyeballs you got on your ads.
A high IS suggests that your ads are attracting attention. They pop up often when people search for your target keywords. IS is important to maximize your campaign reach. IS is important to maximize your campaign reach.
Calculation: IS = (Total Impressions Received / Total Eligible Impressions) * 100
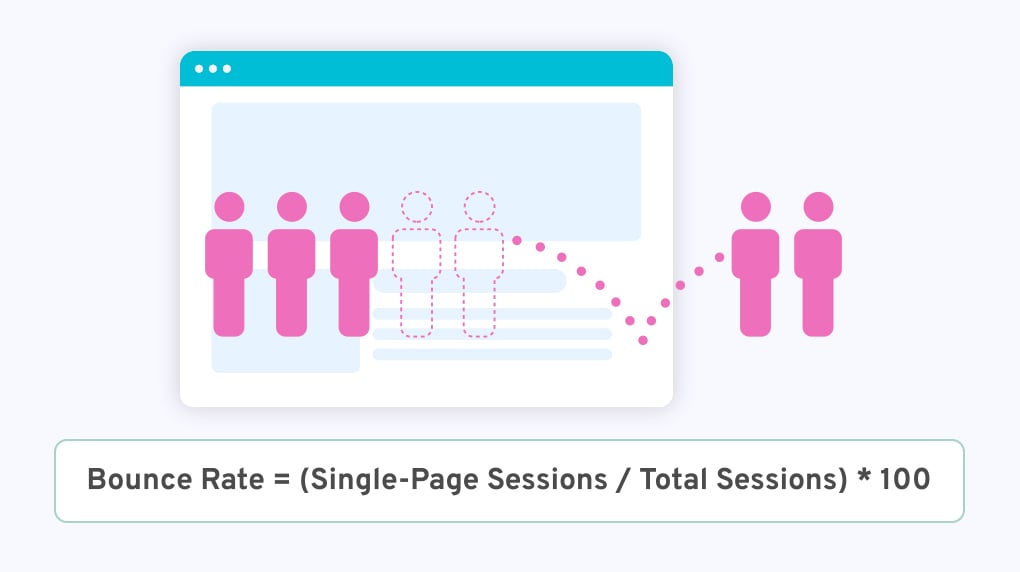
Your bounce rate is the percentage of users who land on your website but leave without interacting further. They essentially ‘bounce away.’
A high bounce rate may indicate a disconnect between your ad and landing page content. If this happens, look at your ad and your landing page from your user’s perspective and see if you’re misleading your audience. Optimizing this metric can lead to improved user engagement and conversions.
Calculation: Bounce Rate = (Single-Page Sessions / Total Sessions) * 100
Ad Spend is the total amount of money you invest in your PPC campaigns. Tracking ad spend is crucial for budget management. It helps you to make sure your campaigns stay within your allocated budget while delivering desired results.
Calculation: The sum total of all the costs associated with each campaign, ad group, or keyword.
Less commonly discussed but vital PPC metrics can provide you with a deeper understanding of your campaigns. This can give you a competitive edge. These metrics offer nuanced insights, which can help you to optimize ad strategies. Here are some of these lesser-known metrics.
In-depth impression share (IS) metrics are specific to Google Ads. There are:
These metrics can help you understand how often your ads are seen and why they might not be shown to potential customers. Wondering how to measure PPC Google metrics specific to impressions?
In your Google Ads dashboard:
Ad schedule metrics show how your campaigns perform at different times of the day or days of the week.
Understanding when your audience is most active and when conversions are most likely to occur can help you optimize ad scheduling. You can allocate budget and bid adjustments to align with peak performance periods, maximizing your ROI.
Analyzing performance by device type reveals how your ads are performing on different platforms.
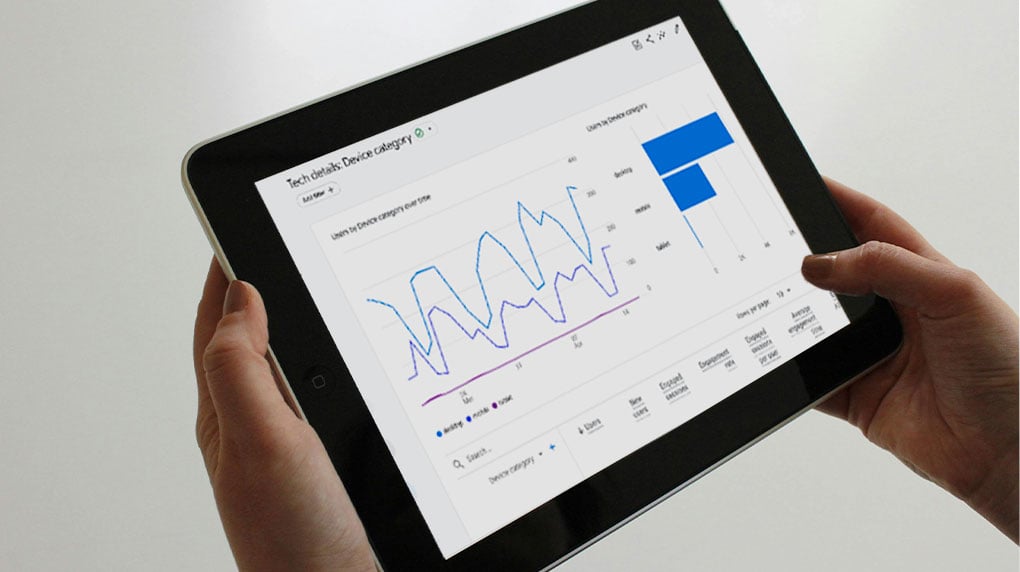
Understanding device-specific performance helps you to tailor ad creatives, bidding, and landing page experiences to each device. If your ads aren’t set up properly for mobile viewing, but all of your customers are shopping on your phone, you’re going to lose sales. This metric will show you where those bottlenecks are.
What is a good PPC metric, anyway? How do you know whether or not your campaign numbers are actually an indication of success? Are your KPIs for PPC being served by your tactics?
You can tell in one of two ways:
Teck, a leading Canadian mining company, aimed to promote antimicrobial copper in public spaces through its Copper & Health campaign. Major Tom's data-driven approach led directly to the campaign’s success.
Teck’s award-winning campaign sought to raise awareness about copper's infection-fighting properties. To do so, it needed to engage multiple audiences, including government decision-makers, the public, students, health leaders, patients, and Teck SR Management. Goals included advocating for copper use, creating pilot program momentum, and enhancing Teck's reputation.
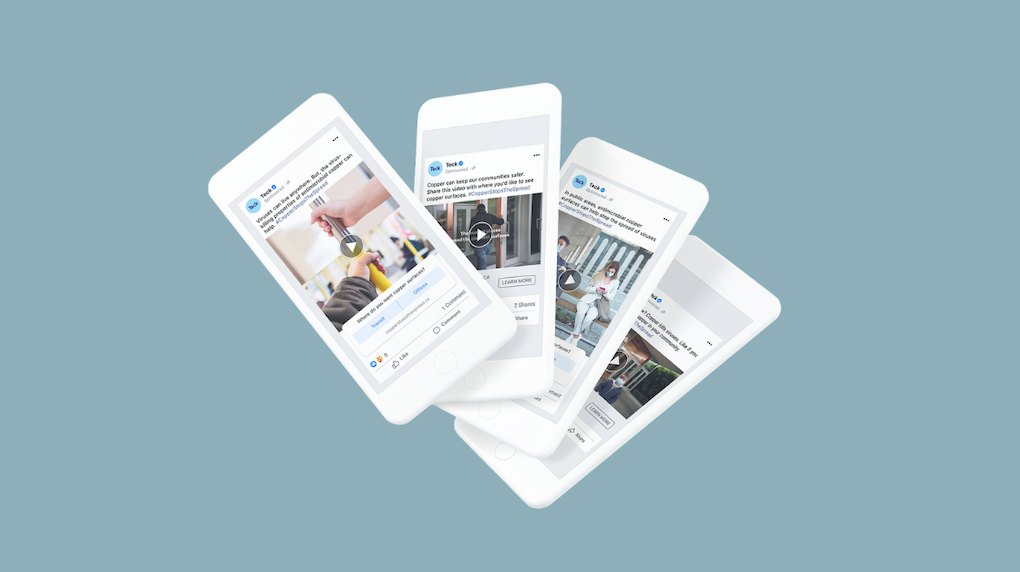
Our strategy used data from Nielsen Vividata to identify the best media channels for each audience. Channels like social media, connected TV, mobile, and out-of-home advertising were selected. Comscore pinpointed websites and social media platforms for effective targeting.
The campaign used a full-funnel approach. It employed display ads, video ads, digital OOH, paid social ads, and remarketing. This aimed to build awareness and drive conversion.
Tailored messaging, A/B testing, and location-specific ads engaged each audience effectively. Regular creative refreshes in tandem with our partner, Will Creative, ensured relevance.
The campaign results were impressive, to say the least:
For more insights about how these results were accomplished, check out our three marketing insights from Teck's winning campaign.
PPC metrics empower data-driven decisions, ensuring efficient budget allocation and campaign optimization. While interpreting these metrics can be challenging, the benefits far outweigh the complexities.
Embrace the data, interpret it wisely, and watch your campaigns reach new heights. Continue your PPC education with our in-depth PPC ROI article, and may your campaigns always be optimized!
Be both a dreamer and a doer.